without data, we are
blind.

— instead of wandering in the woods, you can Stand on the shoulders of Giants.

Liquidity
matters.

Liquidity drives the Market.

Our liquidity indicators gauge market conditions and traders’ positions to calculate the right entry and exit prices. You can now access our liquidity indicator by renting it or asking for snapshots.

instructions

It is highly recommended to learn what each line is showing on the chart so you can understand the market dynamic.

1. This line shows the liquidity equilibrium, where the price should be if we have equal buying and selling pressure. When the price is above this line, we can assume that there is higher buying pressure, and when the price is below this line, we can assume that there is higher selling pressure in the market.
When the price is below this line and attacks it, it tells us that there are sellers above the equilibrium line, and if the price manages to go above it and stays there, buyers will be in charge.
When the price is above this line and attacks it, it tells us that there are buyers below the equilibrium line, and if the price manages to go down and stays there, sellers will be in charge.
In simple words, when we are above it, there are more buyers, when we are below it, there are more sellers.

2. This line shows the median open position price for buyers. We know that buyers have different entry prices for their positions. This line shows the average entry price for their positions weighted by their position size.

3. This line shows the price where 90% of sellers will be in loss.

4. This line shows the median open position price for sellers. We know that sellers have different entry prices for their positions. This line shows the average entry price for their positions weighted by their position size.

5. This line shows the price where 90% of buyers will be in loss.

6. This is the liquidity condition indicator, the most crucial part of your chart. You cannot interpret the liquidity band without understanding and incorporating this indicator. It shows the current level of participation of Retail traders in the asset.
A drawdown in liquidity, while the price is contracting and moving to the downside, indicates the continuation of an up move. However, if the price goes up in an uptrend and liquidity conditions fall, it means that all the retail traders have closed their shorts and it indicates the start of a reverse trend.

7. Pressure indicator shows built-up pressure in both directions.

8. How many terminals are using your account to fetch data from our servers.
The same idea is also valid in a bearish market.

What timeframes do we recommend?

We have tested this indicator in many timeframes and the timeframes that we recommend are Weekly, Daily, 4-Hour, and 1-Hour. Timeframes lower than 1 hour are not supported by this indicator due to a lack of sufficient data and unbearable computational power consumption.

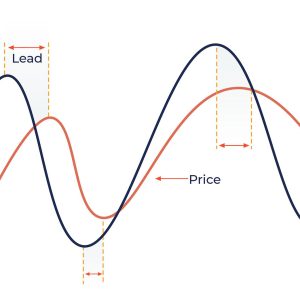
How to use the Liquidity Indicator?

Liquidity drives the price, everything else is a delusion. But how can we find a reliable source to see how buyers and sellers react to changes in the price of a security and position accordingly? There are many services out there providing details on market participants’ positions in different asset classes though they are limited to a few assets. To overcome this, we have developed two unique indicators for MetaTrader 4 and 5 Platforms, providing you with the liquidity condition of many markets. As long as the asset has enough dataset and a unique recognizable symbol, it will work, even on emerging market symbols or cryptocurrencies.


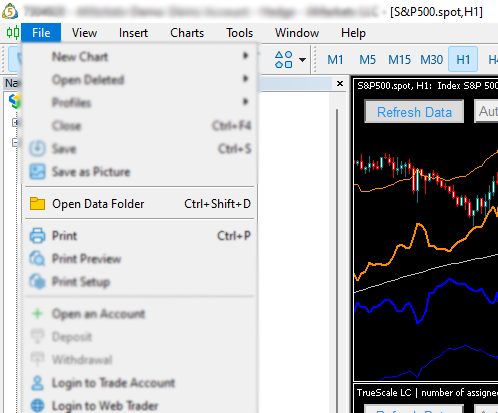
How to install the Liquidity Indicator?

Step 1: subscribe

To get the indicator files, you need to subscribe to the service. The indicator comes in two different versions, one supports lower time frames, and the other can be used only for higher time frames. please check if the indicator you are paying for supports your required timeframes.

Step 2: finding the necessary information

After you have subscribed and completed your transactions, you need to find and write down two parameters. Go to the Subscription section on our website, or use this link, and see if you have an active subscription for the indicator. Then, click on the subscription details.

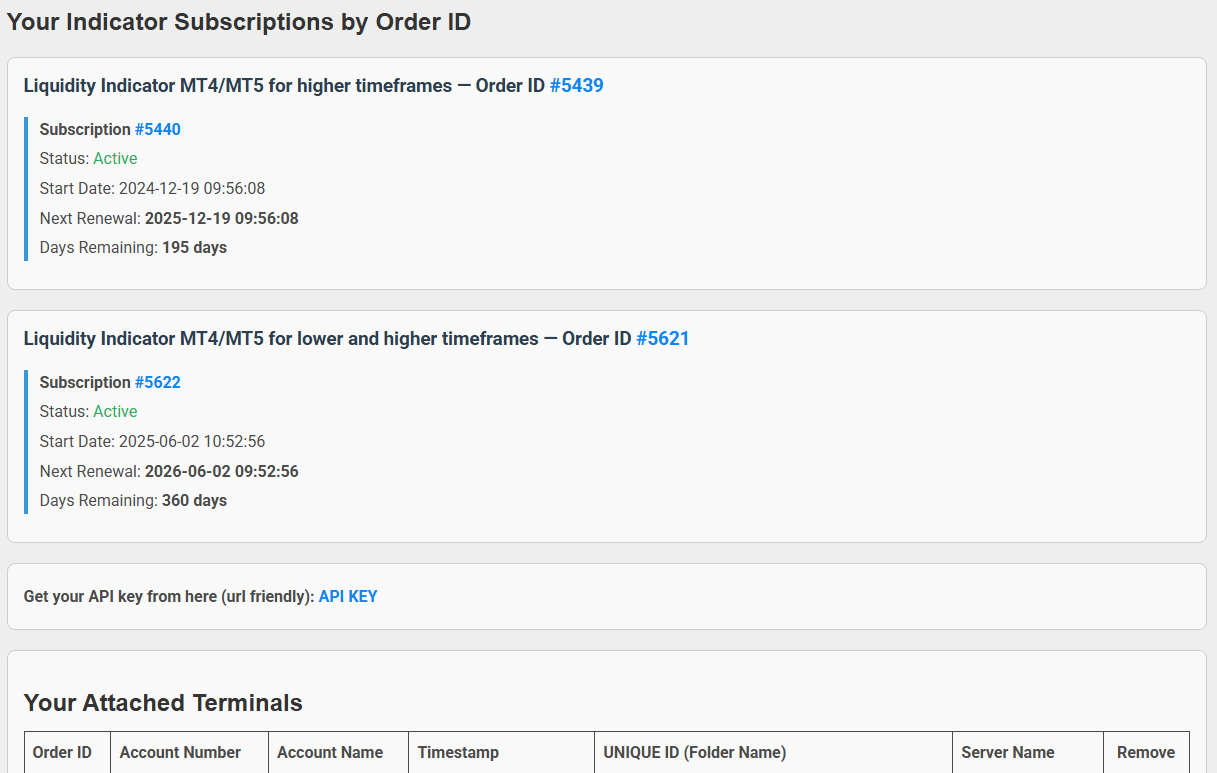
In the detail section of your active subscription, look for Related Orders and remember the Order ID.

You will use this Order ID and your email address as your indicator credentials.

Step3: download and install the indicator
  1. Go to the Downloads section in your account, or by clicking here.
  2. Download the suitable version of the indicator for your MetaTrader platform.
  3. Extract the files.
  4. open your MetaTrader and from the top menu select File, then Open Data Folder.
  5. Open the MQL5 or MQL4 folder.
  6. Inside the MQL5 or MQL4 folder, there is an Indicators folder, move the downloaded files that you have extracted there.

Now, you are ready to add the indicator to your chart, but before pressing the OK button you should take a few more steps.

Step4: adjust settings
  • Add the indicator to your chart.
  • If you use MetaTrader 5, on the Dependencies tab Allow DLL Imports.
  • If you use MetaTrader 4, on the Common tab Allow DLL Imports.
  • Then on the Inputs tab, enter The login credentials you wrote down.