
Disclaimer: This page is our contribution to Prof. Dr. Sornette’s work and TFRI and its parent company, TrueScale GB, has not yet been in contact or collaboration with him.
Professor Sornette’s research revolves around the hypothesis that extreme risks and gains often emerge as ‘dragon-kings’, stemming from a drift towards critical instabilities, with discernible precursors at technical and socio-economic levels. He employs rigorous data-driven mathematical and statistical analysis, coupled with nonlinear multi-variable dynamical models incorporating both positive and negative feedback mechanisms. This approach enables him to investigate the predictability and management of crises and extreme events across complex systems. His research spans various fields, including financial bubbles and crashes, earthquake physics, geophysics, dynamics of success within social networks, and applications in medicine such as the study of systemic instabilities in the immune system and epilepsy.
Behind the scene
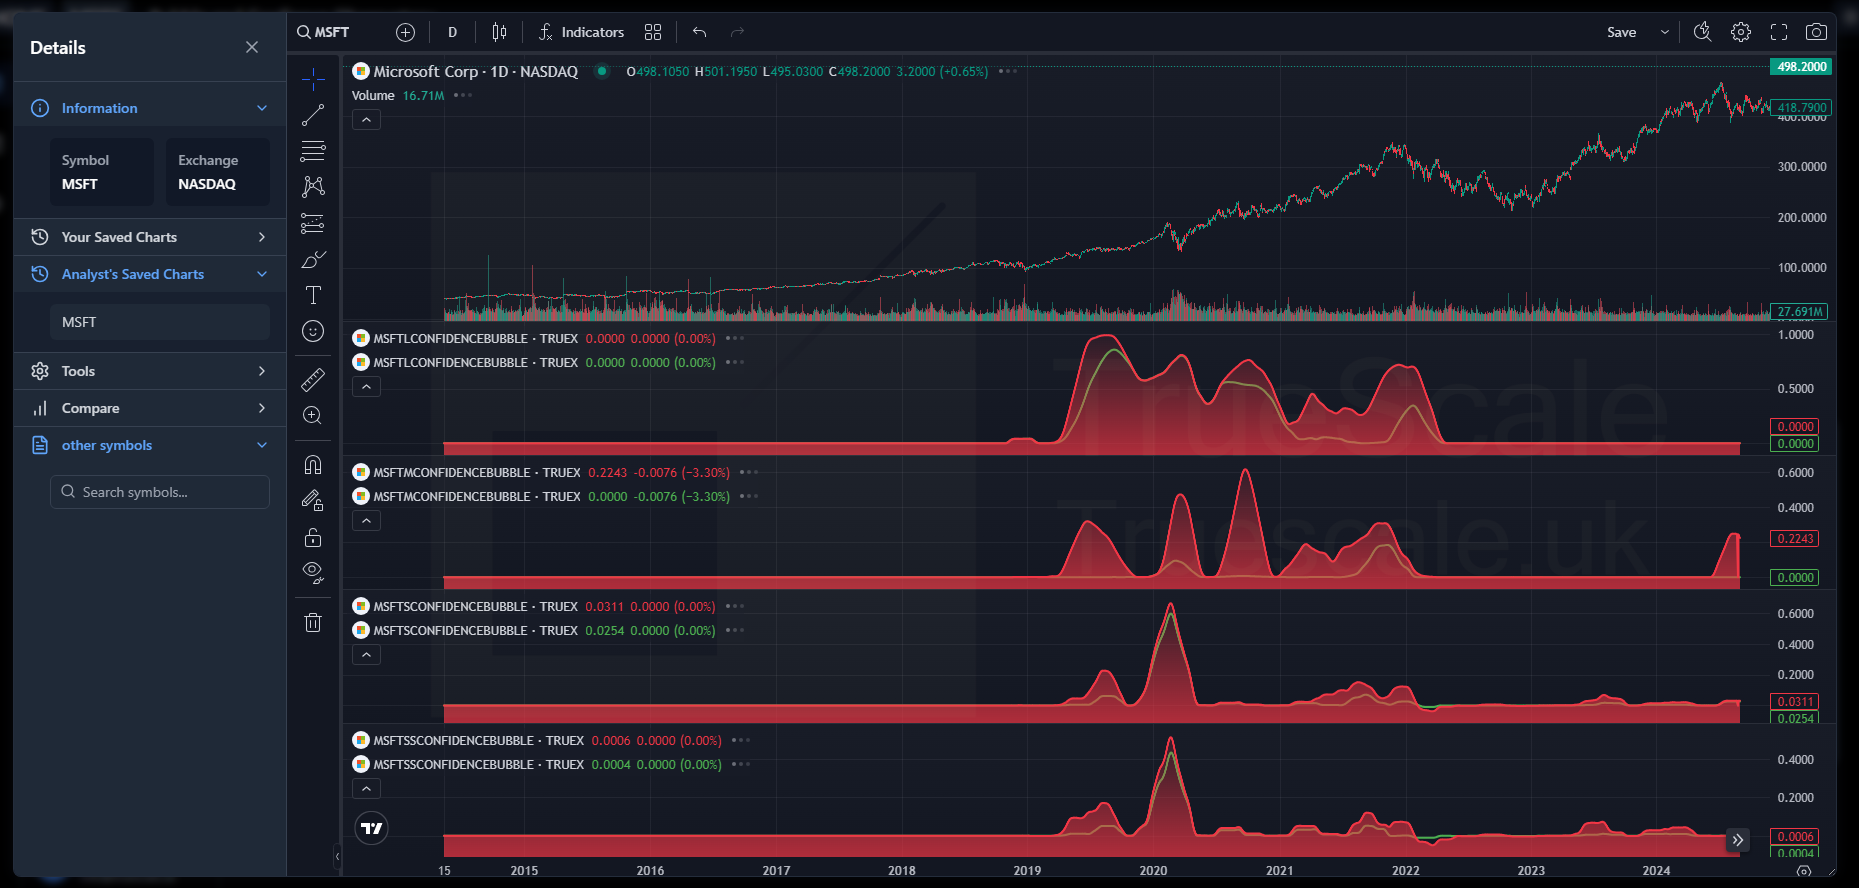
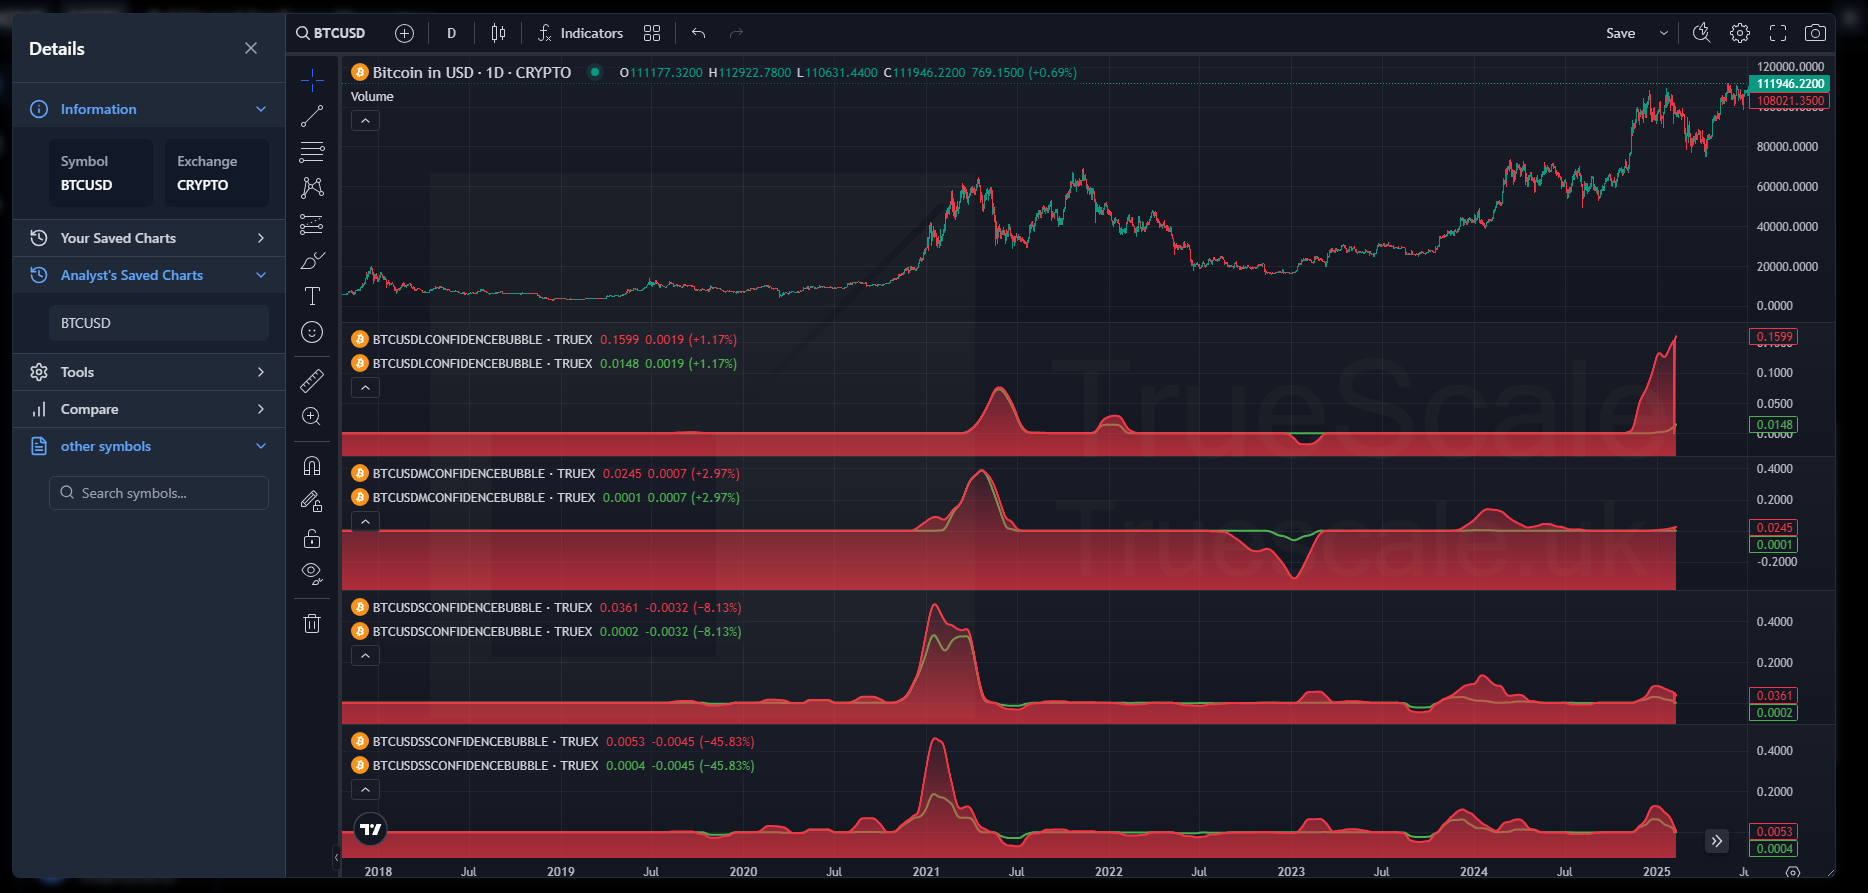
All the calculations we provided above are based on Prof. Dr. Didier Sornette’s latests studies on financial markets. He is the director of the Financial Crisis Observatory (http://www.er.ethz.ch) and a member of the Swiss Finance Institute.
By integrating the economic theory of rational expectation bubbles with insights from behavioral finance regarding imitation and herding behaviors among investors and traders, as well as drawing from mathematical and statistical physics principles of bifurcations and phase transitions, Professor Sornette has pioneered the development of the log-periodic power law singularity (LPPLS) model for understanding financial bubbles. This model identifies the faster-than-exponential increase in asset prices, characterized by accelerating oscillations, as a key indicator of bubbles. It captures the interplay between positive feedback loops driving higher return anticipations and negative feedback spirals fueled by crash expectations. Originally conceived in 1995 to predict the failure of critical pressure tanks on the European Ariane rocket and as a theoretical framework for forecasting earthquakes, the LPPLS model was later adapted to analyze financial bubbles and their subsequent bursts. This work was independently proposed by Feigenbaum and Freund, as well as Sornette, Johansen, and Bouchaud, and further refined within the rational expectation bubble framework by Johansen, Ledoit, and Sornette, a framework now known as the JLS model.


