The Market Situation Report is a condensed version of our institutional newsletters, infused with a touch of humor. We plan to release it daily, right before the opening of the US market, and present it in a most familiar format to retail traders’ eyes by using Tradingview charts and Memes. To learn about the incentives behind it you can visit the link below.
What is going on with the AI boom?
In the past two years, a new hype has been driving the markets higher: artificial intelligence (AI). AI has promised to revolutionize work, and it has delivered on most of these promises. The Chat GPT-4 model is incredibly smart, fast, and breathtakingly impressive. Industries across the board are adapting to this new trend, seeking more AI and less workforce. While we are certain about the increased adoption of AI, the impact on employment remains uncertain, and we need to wait for unemployment numbers to come out.
This shift towards AI relies heavily on one essential component: chips, specifically Nvidia’s chips. This demand is driving Nvidia’s stock price exponentially higher. However, this raises the question: are we in an AI-driven bubble?
in the previous Market SITREP #3 we gave you some hints about Nvidia’s stock movement and if you haven’t read that, don’t worry, we will include the same charts here. But first, let’s talk about Nvidia.
What do we know about Nvidia?
Looking at the historical Nvidia chart suggests that Jensen Huang might view Nvidia’s stock as a cash cow. It’s important to understand that Nvidia’s chip-making performance and innovation are not directly correlated with its stock price. Even if tomorrow’s stock trades at $10, everyone will still get their Blackwell chips. Additionally, there is nothing inherently wrong with Jensen Huang and other insiders profiting from selling their stocks.
If we examine past stock price movements, we can observe a pattern similar to Bitcoin, characterized by high volatility.

In the chart above, the green line represents total oil production by major countries, and the red line represents total liquidity from the world’s largest central banks. Observing the chart, Nvidia’s bull runs typically last until the stock price increases by twelvefold, followed by a crash. The exception to this pattern was in 2012 when the stock price increased by 23 times.
The period from 2012 to 2020 was marked by significant expansion, driven by increased oil production and global liquidity. This era required substantial energy to fuel the growth. However, we are not in the same environment now.
Moreover, If you read this article from 2012, you will find out that no matter what the experts say, Nvidia stock doesn’t run on their expectations but it runs on market fundamentals.
Nvidia and Treasury Yields
If you look at the chart above, it is obvious that high interest rates are not favored by the tech sector. Today, yields on most treasuries, whether from Japan or the US, are at their highest in a decade. Central banks, including the Federal Reserve, are not raising rates out of preference but out of necessity to slow down high inflation and cool the economy. Additionally, higher oil prices can hamper the tech sector. Therefore, if central banks manage to control energy prices through their rate policies, it might initially benefit tech stocks, but could eventually lead to their decline.
Printing to oblivion and the Lesson We Can Learn from collapsing Economies
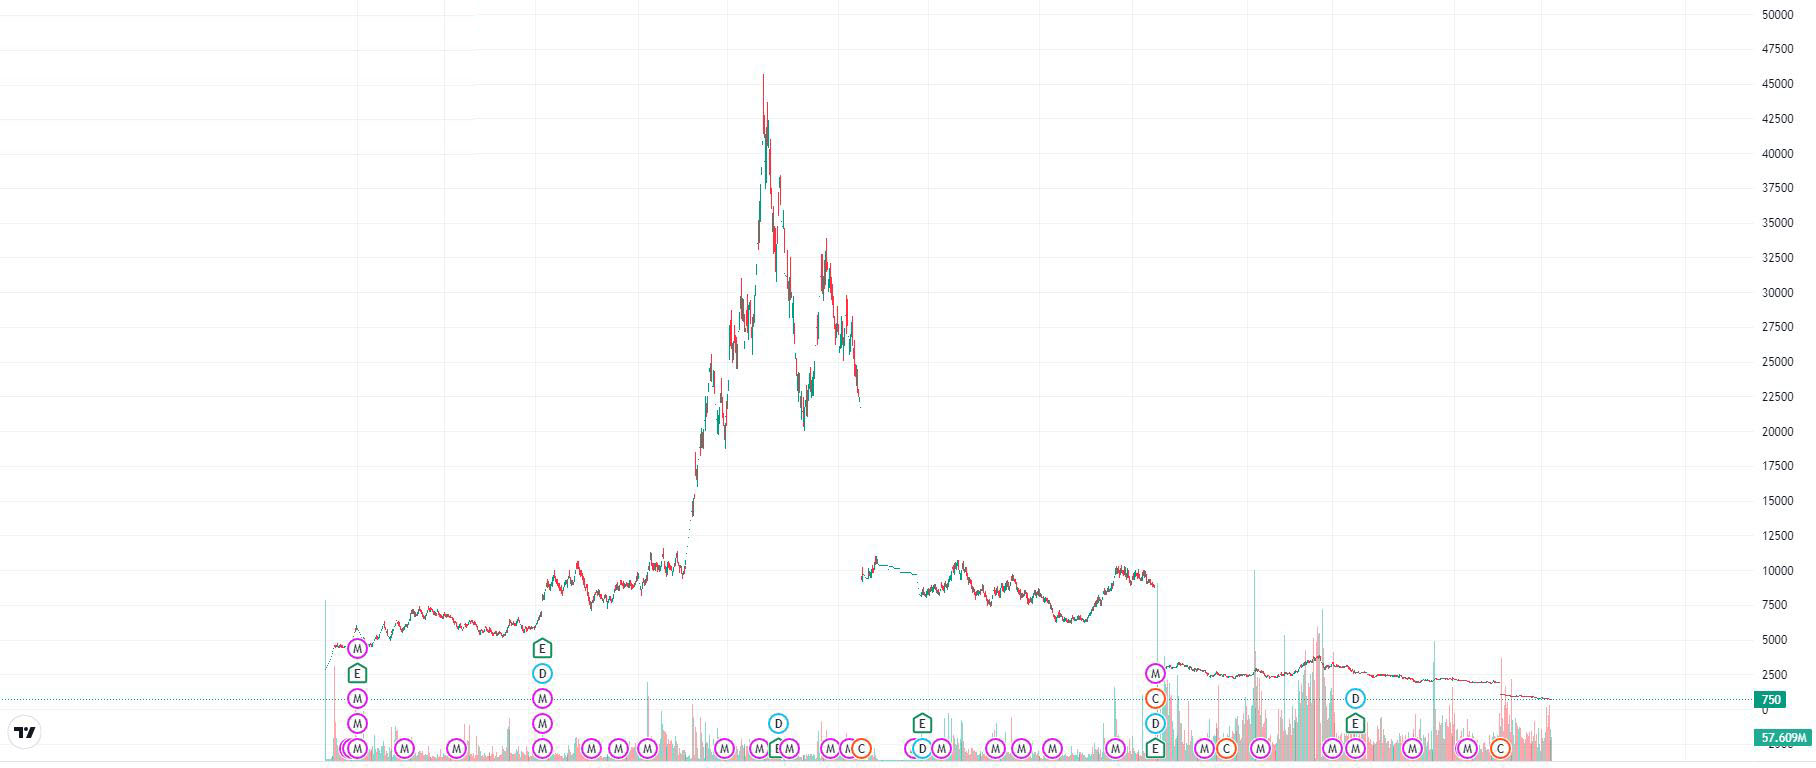
The chart above shows one of the few tech stocks that generate cash and have strong ties with the central government in a collapsing economy. Countries that have adopted cash printing to address deficit spending have millions of companies displaying similar chart patterns. The majority of these companies are held by institutions such as pension funds, banks, and holdings. Despite paying dividends and generating positive cash flow, these companies experience periods of boom followed by long-term busts.
Even though the base money in these countries depreciates against the US dollar, their stocks show no signs of recovery, almost by design. These companies act as liquidity drains, absorbing money from investors and retail traders and returning only a fraction of their initial investment, effectively curbing inflation.
You might say that the US is different and that this never happens here! However, the current options market in the US has enabled Nvidia to use call options as a tool for driving its price higher. Company announcements, presentations, and shows are strategically designed to maintain investor confidence in the stock, preventing them from selling. This forces market makers to buy shares to hedge their portfolio to be delta-neutral.
Another behavior in the options market that can result in billions of dollars being wiped out is that many retail investors tend to sell puts and buy calls. This practice often renders them the main losers in the market.
To add more, the last reports indicate that NVDA has experienced a total of 15B$ hedgefund outflow and names like Paul Tudor Jones, Stanley Druckenmiller, and Jim Simons are on the list with at least offloading 64% of their shares.
Disclaimer: Engaging in trading is a challenging endeavor that demands careful consideration and should not be undertaken by individuals indiscriminately. It is crucial to acknowledge the potential risk of losing one’s initial investment in instances of erroneous trades or excessive exposure to a particular asset, especially when employing excessive leverage. Consequently, we strongly advise utilizing prudent investment solutions to administer and safeguard your portfolio effectively. Visit Investing Solutions for more information.