The Market Situation Report is a condensed version of our institutional newsletters, infused with a touch of humor. We plan to release it daily, right before the opening of the US market, and present it in a most familiar format to retail traders’ eyes by using Tradingview charts and Memes. To learn about the incentives behind it you can visit the link below.
What market say about today’s CPI release?
Have you ever asked yourself if it is possible to predict the CPI number before it is released? Seems impossible, isn’t it? When it comes to major market data releases, the retail trader’s positioning is not something that you need to focus on, but it is the huge stakeholders that we need to pay attention to. Let me ask you a question. what if you manage a portfolio of 50 B$ and today is the CPI release date? Would you do everything you can to know what the CPI number is going to be? And by everything, we mean everything. What if you come unprepared?

It is not like big guys don’t know what is the data beforehand. Oh, come on. You hang out with big guys, you get the benefit of hanging out with big guys! But you know what? When you know something, you have to position yourself accordingly, and that will show its trace on the market fluctuations. You just need to follow the crumbs. So, let’s do it!
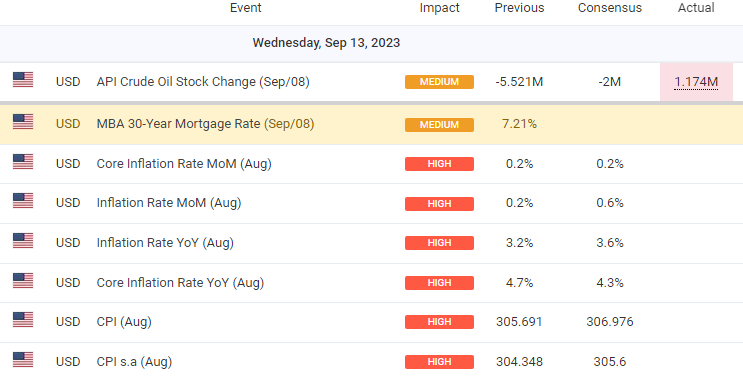
So, apparently market expects a 0.4% increase in MoM inflation. Not considering constant revisions in data provided by BLS, we already know that the market is priced in for a higher inflation number (is it really?). Let’s start with Asia to see if we can find a clue!

This chart kind of makes sense! Stronger Asian currency comes with a lower price in NVidia! It works as a money flow gauge. If we need more electronics here in the US, we go somewhere where it’s cheap to produce and we bring our USD’s there to buy! Let’s invert USDJPY and make it visually simple to read!
Pay attention to highs and lows in both NVDA and USDJPY. They are almost like a money trap! But that was before 2009! Entering the age of QE!
49X return in the age of constant QE! Who cares about USDJPY anymore? Money is coming and constantly bidding for stock! Have you heard about passive investors? Pension funds?
As you can see in the chart above, After December 2021, market dynamics and correlation between JPY and NVidia have changed. Now what?
I would be happy if we add US treasuries to this chart!
Nothing happens in a vacuum, in particular in financial markets! The clue that we are looking for is in USDJPY.
If 10Y breaks through 4.35%, and by breaking I do not mean a slight touch, we are done with the bull market in SP500 and NASDAQ. And what would be the catalyst of that scenario happening? A higher-than-expected MoM inflation rate. Any data leak? Although we could not find any data leak, the current price levels in different assets indicated that many have stayed on the line and possibly hedged their positions not for the best but worst scenario possible!
Disclaimer: Engaging in trading is a challenging endeavor that demands careful consideration and should not be undertaken by individuals indiscriminately. It is crucial to acknowledge the potential risk of losing one’s initial investment in instances of erroneous trades or excessive exposure to a particular asset, especially when employing excessive leverage. Consequently, we strongly advise utilizing prudent investment solutions to administer and safeguard your portfolio effectively. Visit Investing Solutions for more information.